What Turnover Really Costs: The Hidden Expenses No CFO Is Tracking

Why recruitment spending is the visible tip of an iceberg, and what the evidence actually shows
Organisations count recruiting costs and call it turnover management. In doing so, they systematically ignore the part that is two to five times larger: the productivity loss that accumulates before a replacement is even hired, and that frequently begins before the departing employee has given notice. Turnover is not an HR problem. It is a strategic cost risk that the majority of organisations measure incorrectly and therefore consistently underestimate.
Executive Summary
Hidden turnover costs exceed direct recruitment and onboarding expenses by a factor of two to five, with productivity loss as the dominant driver at 60 to 93% of total costs, followed by team coordination disruption and temporary staffing expenses.
63% of productivity losses occur before the departing employee has even left the organisation, a mechanism that no standard turnover reporting captures.
Depending on role complexity, total turnover costs range from 40 to 400% of annual salary; for specialised positions, they routinely exceed 100%, with a strongly non-linear increase as complexity rises.
1. The Measurement Problem: Why Organisations Systematically Underestimate
What is not measured is not managed. In most organisations, turnover is a precisely tracked recruiting process and a systematically unmeasured productivity gap.
A meta-analysis across 25 empirical studies spanning healthcare, manufacturing, hospitality, and retail, drawn from a semantic search across 138 million academic sources, reveals a consistent pattern: organisations that measure only direct costs (job posting, interviews, onboarding) report turnover costs that are one-third to one-fifth of those reported by organisations that comprehensively include indirect costs (Ruiz et al., 2016; Roodt & Bothma, 1997). A South African service organisation initially calculated technician replacement costs at R 94 million, and arrived at R 470 million upon full inclusion of hidden costs, a fivefold increase (Roodt & Bothma, 1997).
The measurement problem is structural: recruitment expenditures are bookkeeping-legible. Productivity loss during onboarding, declining team performance after resignation announcements, and the knowledge-transfer burden on remaining staff appear in no cost centre report. They occur nonetheless, and dominate the actual cost structure.
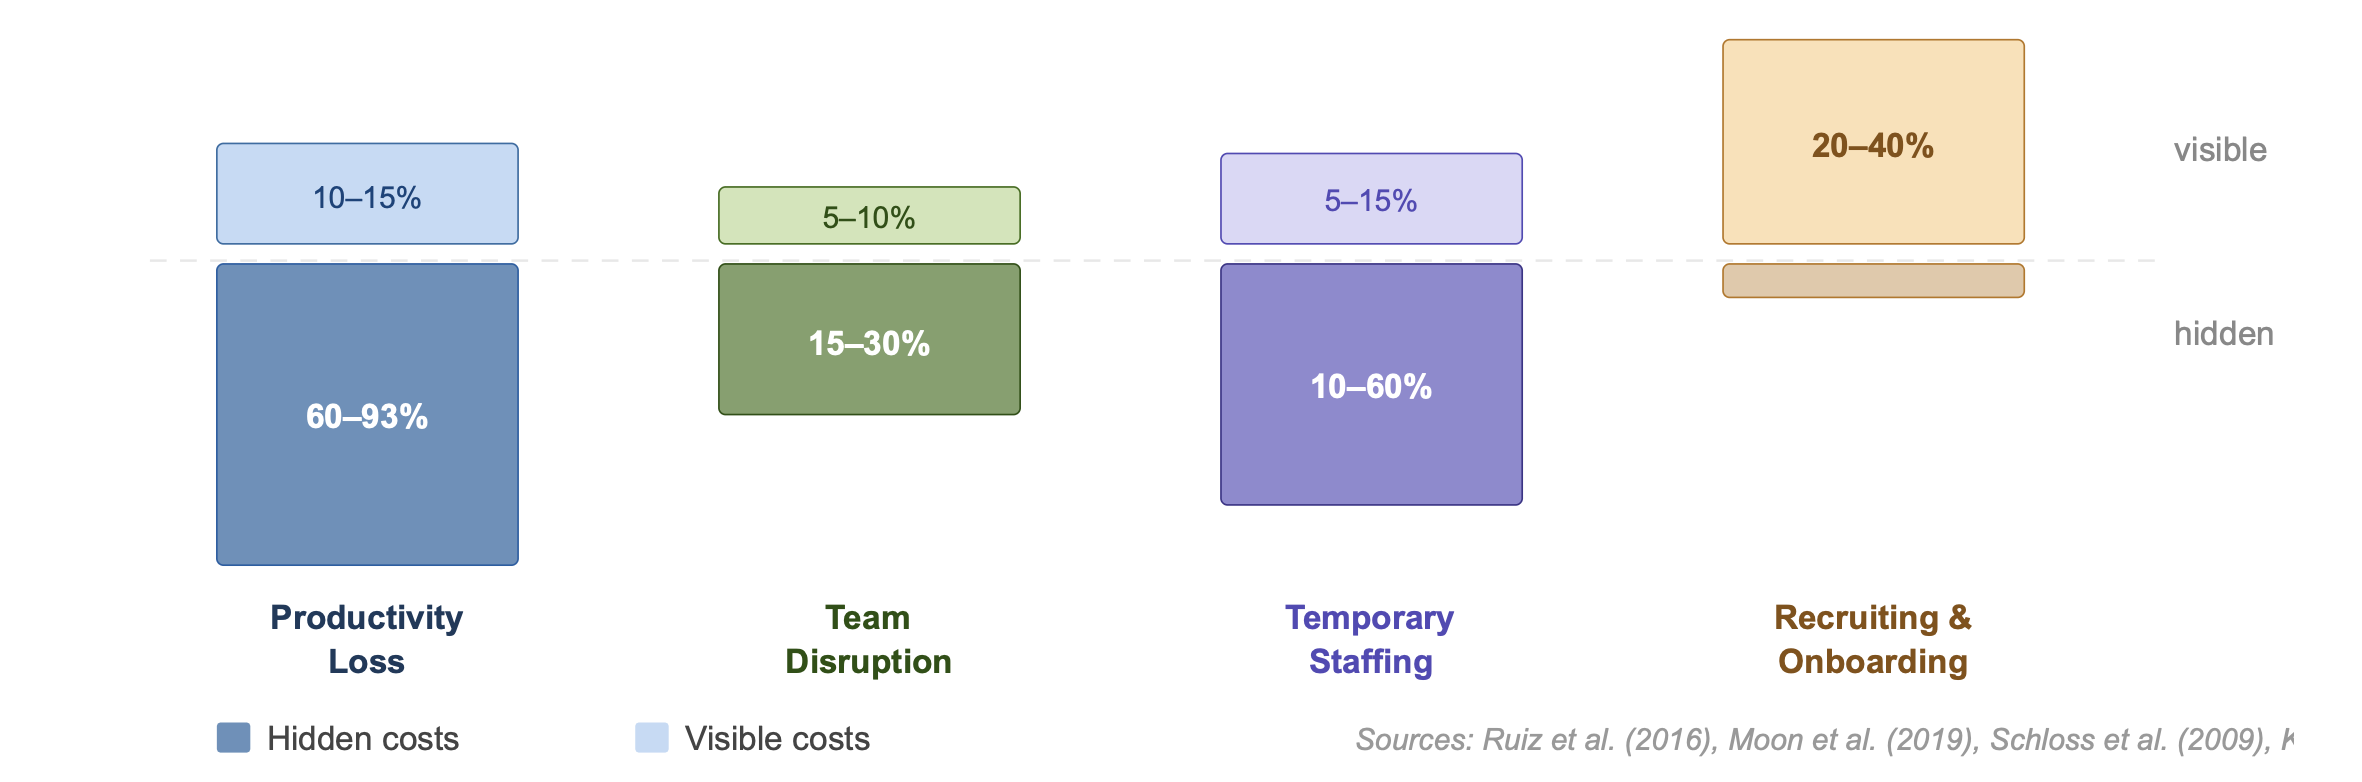
👉 Key Insight: The turnover problem is primarily a measurement problem. Organisations reporting only recruitment costs are examining 20 to 40% of actual costs, and making retention decisions on a data foundation that systematically points in the wrong direction.
Figure 1: Cost structure of a departure, visible vs. hidden cost shares (ranges across industries)
2. Productivity Loss: The Invisible Primary Driver
60 to 93 percent of total turnover costs arise from productivity loss. Not from job postings, not from interviews, from the learning curve of new employees, and from an effect most organisations do not track at all: the pre-departure loss.
In a hospital study, 93.6% of post-departure costs were attributable to reduced productivity among newly hired nursing staff (Ruiz et al., 2016). In manufacturing, Moon et al. (2019) quantified the turnover effect at USD 206 to 274 million in quality costs from defective products, from a single product line. The same dataset shows that reducing turnover could have lowered variable production costs by 4.5%, representing approximately USD 928 million in potential savings.
Particularly instructive is the pre-departure effect: in a retail study covering teams of two to seven employees, 63% of productivity losses occurred before the individual in question had even left the organisation (Kuhn & Yu, 2019). The mechanism is traceable: once a resignation is internally known, team investment declines, in the departing person, and in all workflows linked to them. Simultaneously, remaining employees begin allocating time to successor activities rather than their primary responsibilities.
👉 Key Insight: Productivity loss begins with the departure decision, not with the final working day. Organisations that treat turnover as a cost problem only at the exit point have already incurred the majority of the costs without ever measuring them.
3. Role Complexity: Why Costs Escalate Non-Linearly
Replacing a cashier costs different orders of magnitude from replacing a senior surgeon. That is intuitively clear. The actual range is still surprising: factor five within the same organisation, and factor ten across industries.
Schloss et al. (2009) analysed turnover costs at an academic medical centre: replacing a general physician cost USD 115,554; replacing a surgical subspecialist cost USD 587,125, five times as much, within the same institution, for formally similar positions. The difference is explained by three factors: higher compensation costs during the vacancy, longer recruitment timelines, and deeper onboarding curves driven by specialised knowledge and patient relationships.
In knowledge-intensive manufacturing environments, Carriquiry (2012) shows that the largest single cost block for engineer positions falls on the period of complex tasks and prolonged onboarding. Hamidi et al. (2018) quantify institutional costs of USD 15.5 to 55.5 million for burnout-driven turnover within a single academic centre. The total cost range per departure, by role complexity, runs from 40% to 400% of annual salary (Ruiz et al., 2016; Schloss et al., 2009; Roodt & Bothma, 1997).
👉 Key Insight: Retention investments must be role-sensitive in their calculus. A 15% salary increase for a position whose turnover costs 200% of annual salary is not a cost problem, it is a protective investment with a positive ROI.
4. Team Coordination and Knowledge Loss: The Ripple Effect
Turnover does not only affect the person who leaves. It affects the team that remains, generating downstream costs that propagate through the organisational structure over months.
Moon et al. (2019) show that turnover in assembly lines disrupts not only individual productivity but coordination between team members, with direct impact on field failure rates and customer satisfaction. Schwab (2025) documents that for primary care practices, a physician change led to a 1.7 percentage point increase in specialist referrals and raised total patient costs by 3 to 5%, because specific patient knowledge was lost and access to that knowledge for remaining team members was removed.
In remote regions of Australia, with an average turnover rate of 150%, each 10% increase in annual turnover generated an additional A$ 6.12 per consultation. Scaled up: A$ 400,000 per clinic per year, A$ 21 million across the entire Northern Territory system (Zhao et al., 2019). Knowledge loss is not abstract, it has a precise address in the cost account, provided the organisation measures consistently enough to find it.
👉 Key Insight: Turnover damage distributes across the team. Remaining employees absorb recruitment tasks, lose coordination partners, and manage more complex workloads. These costs appear in no turnover statistic, and drive subsequent turnover that itself goes unmeasured.
Action Recommendations
Immediate Measures - This Week
Shift turnover cost accounting to a full-cost basis: take direct costs (recruiting, onboarding) as a starting point, apply a conservative multiplier of 2 to 3, and assess whether the organisation is prepared to adjust its retention investments accordingly.
Introduce pre-departure monitoring: what signals indicate withdrawal behaviour in which teams? Declining meeting participation, falling output quality and absence of development requests are documented early indicators (Sagie et al., 2002).
Map role complexity: for which positions does the turnover cost factor exceed 100% of annual salary? These positions require prioritised retention measures, irrespective of whether departures are currently visible.
Strategic Commitments - 6 to 24 Months
Introduce a comprehensive turnover cost model: capture productivity loss (differentiated by onboarding duration), team disruption costs and temporary staffing costs systematically, not as an HR metric, but as a business management variable at CFO level.
Build retention ROI calculations for key roles: for positions with turnover costs of 150 to 400% of annual salary, every retention measure up to that amount is economically justifiable. Make this calculation explicit and incorporate it into compensation and development decisions.
Institutionalise knowledge transfer protocols for all critical departures: knowledge transfer requires investment, but it prevents the downstream productivity loss that accounts for 60 to 93% of total costs. This investment is not optional; it is cost management.
Integrate team coordination metrics into turnover post-mortems: six months after a significant departure, systematically examine team performance, customer satisfaction and subsequent turnover for correlations with the departure event.
Final Thought
The paradox of turnover is straightforward: the most expensive costs arise invisibly, before the problem appears in any reporting line. Organisations that measure their turnover costs in job postings and onboarding hours are optimising 20 to 40% of the problem and ignoring the rest. Retention is not an HR measure with a soft ROI. It is cost management, with a measurable, calculable and, in the majority of cases, clearly positive return. The only thing still missing is the willingness to measure the uncomfortable part as well.
How does your organisation currently measure turnover costs, and have you ever explicitly calculated the productivity loss during onboarding? Share your perspective or read our analysis on decision quality under uncertainty: why leaders systematically optimise the wrong variables.
References
Carriquiry, J. M. (2012) Walking Assets: The Cost of Losing an Employee. SSRN Working Paper. https://doi.org/10.2139/SSRN.2519571
Hamidi, M. S., Bohman, B. D., Sandborg, C., et al. (2018) Estimating institutional physician turnover attributable to self-reported burnout and associated financial burden: a case study. BMC Health Services Research. https://doi.org/10.1186/s12913-018-3663-z
Kuhn, P., Yu, L. (2019) How Costly Is Turnover? Evidence from Retail. Journal of Labor Economics. https://doi.org/10.1086/710359
Moon, K., Bergemann, P., Brown, D., et al. (2019) Manufacturing Productivity with Worker Turnover. Management Science. https://doi.org/10.2139/SSRN.3248075
Roodt, G., Bothma, F. (1997) Die koste van vrywillige, beheerbare arbeidomset. SA Journal of Industrial Psychology. https://doi.org/10.4102/SAJIP.V23I1.619
Ruiz, P., Perroca, M. G., Jericó, M. de C. (2016) Cost of nursing turnover in a Teaching Hospital. Revista da Escola de Enfermagem da USP. https://doi.org/10.1590/S0080-623420160000100014
Sagie, A., Birati, A., Tziner, A. (2002) Assessing the Costs of Behavioral and Psychological Withdrawal. Applied Psychology. https://doi.org/10.1111/1464-0597.00079
Schloss, E. P., Flanagan, D., Culler, C. L., Wright, A. L. (2009) Some Hidden Costs of Faculty Turnover in Clinical Departments in One Academic Medical Center. Academic Medicine. https://doi.org/10.1097/ACM.0b013e3181906dff
Schwab, S. D. (2025) The Value of Specific Knowledge: Evidence from Disruptions to the Patient-Physician Relationship. Management Science. https://doi.org/10.1287/mnsc.2021.03884
Zhao, Y., Russell, D., Guthridge, S., et al. (2019) Costs and effects of higher turnover of nurses and Aboriginal health practitioners. BMJ Open. https://doi.org/10.1136/bmjopen-2018-023906